
Where Is E-Waste Generated? Global Data & Tracking
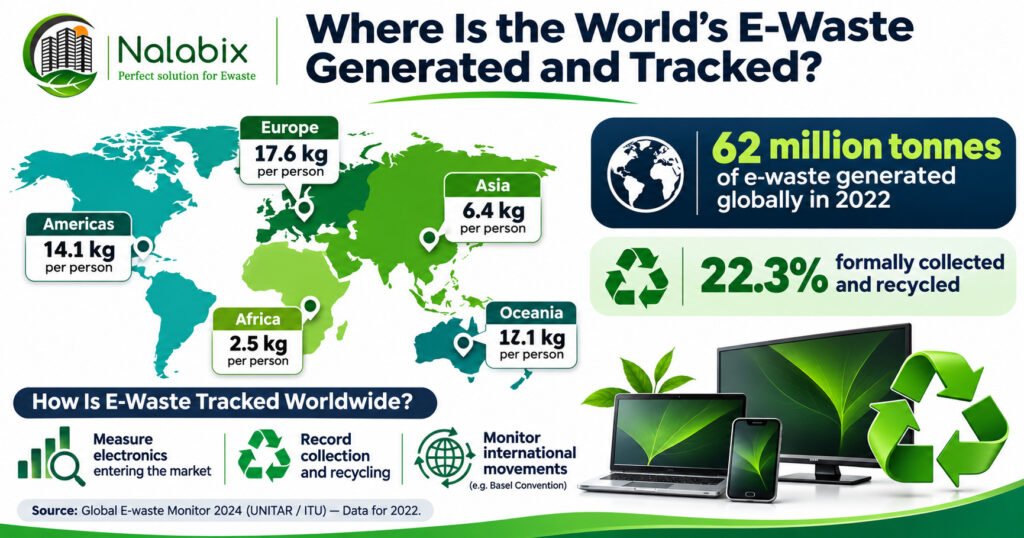
Where Is the World’s E-Waste Generated and Tracked? Electronic waste, commonly known as e-waste, is generated in every region of the world. From smartphones and computers to refrigerators, televisions, and industrial equipment, millions of electrical and electronic products reach the end of their useful lives each year. But where is most of this waste generated, and how do we know what happens to it? Understanding global e-waste generation and tracking helps governments, businesses, recyclers, and communities improve recycling systems, recover valuable materials, and reduce environmental risks. How Much E-Waste Does the World Generate? According to the Global E-waste Monitor 2024, published by the United Nations Institute for Training and Research (UNITAR) and the International Telecommunication Union (ITU), the world generated approximately 62 million metric tonnes of e-waste in 2022. That represents an average of 7.8 kilograms per person. However, only 22.3% was documented as formally collected and recycled through environmentally sound systems. Global e-waste generation is projected to reach approximately 82 million tonnes by 2030 if current trends continue. These findings highlight a growing gap between the amount of electronic waste produced and the quantity recorded through formal recycling systems. Where Is the Most E-Waste Generated? E-waste is generated worldwide, but the amount varies significantly across regions. The Global E-waste Monitor 2024 provides the following regional comparisons for 2022: Region E-waste per person Documented formal recycling rate Europe 17.6 kg 42.8% Oceania 16.1 kg 41.4% Americas 14.1 kg 30.0% Asia 6.4 kg 11.8% Africa 2.5 kg 0.7% Source: Global E-waste Monitor 2024. Recycling rates refer to documented formal collection and recycling. Asia generates the greatest total amount of e-waste, approximately 30 million tonnes in 2022, largely because of its population and extensive use of electrical and electronic products. Europe, however, generates the most e-waste per person. This illustrates an important distinction: the region producing the most e-waste overall is not necessarily the region producing the most per person. Countries with larger populations may generate greater total volumes, while regions with higher electronics consumption and replacement rates may produce more waste per individual. For a closer look at individual countries, read our guide to the top countries producing e-waste. How Is Electronic Waste Tracked Worldwide? Global e-waste statistics are developed using national data, scientific estimates, and internationally agreed measurement methods. One of the leading initiatives is the Global E-waste Statistics Partnership (GESP), managed by ITU and UNITAR’s Sustainable Cycles (SCYCLE) Programme. Its work helps countries measure and compare electronic waste generation, collection, and recycling. Tracking generally involves three important activities. 1. Measuring Electronics Entering the Market Researchers examine the amount of electrical and electronic equipment sold or placed on national markets, alongside estimated product lifespans. This information helps estimate when devices are likely to become waste. 2. Recording Collection and Recycling Governments, producer responsibility schemes, and recycling operators may record quantities of electronic waste collected and processed. These records help measure formal recycling performance and identify gaps in collection systems. 3. Monitoring International E-Waste Movements Electronic waste and used equipment can move between countries for reuse, treatment, or recycling. The Basel Convention establishes international controls on transboundary movements of waste, including e-waste. Its expanded e-waste controls took effect on 1 January 2025, subject to the Convention’s rules for Parties. These controls support oversight of international waste shipments, although they do not capture every movement of used electronics or informal waste flow. Where Can You Find Reliable E-Waste Statistics? Several international organizations publish useful information about electronic waste. The Global E-waste Statistics Partnership provides international e-waste data, country profiles, and monitoring resources. The International Telecommunication Union publishes global monitoring reports and supports countries in improving e-waste statistics. Within Europe, Eurostat publishes data on electrical and electronic equipment placed on the market, waste collection, treatment, and recycling under the EU WEEE reporting framework. National studies also help close information gaps. For example, the National E-waste Monitor Kenya 2026 provides country-specific estimates and insights into collection and recycling practices. Why Is Some E-Waste Missing From Official Records? Not all electronic waste enters documented recycling systems. Some discarded devices remain stored in homes and workplaces, while others enter general waste streams or are handled through informal collection and dismantling networks. In regions with limited collection infrastructure, reliable reporting can be particularly challenging. Importantly, e-waste that is not documented as formally recycled is not necessarily all landfilled or abandoned. Some may be reused, repaired, processed informally, or managed through systems that lack complete reporting. Improving data collection is therefore essential for understanding the actual movement of discarded electronics. Learn more about how e-waste is collected and handled across African markets. Why Does Tracking E-Waste Matter? Accurate e-waste data helps countries understand how much electronic equipment is being discarded, where collection systems are needed, and whether recycling programmes are working. For organizations, responsible tracking also improves accountability. Maintaining asset inventories, collection records, chain-of-custody documents, and appropriate recycling or destruction certificates helps demonstrate how retired electronics have been handled. To understand the practical process, explore what happens to electronics after collection and how organizations can build an effective e-waste management plan. Frequently Asked Questions Which continent produces the most e-waste? Asia generates the largest total quantity of e-waste, while Europe has the highest generation per person, according to the Global E-waste Monitor 2024. Who tracks global electronic waste? The Global E-waste Statistics Partnership, managed by ITU and UNITAR-SCYCLE, coordinates international e-waste monitoring and supports national statistical development. Is all e-waste tracked? No. Informal processing, incomplete reporting, and discarded electronics entering general waste streams make comprehensive tracking difficult. What percentage of global e-waste is recycled? In 2022, approximately 22.3% of global e-waste was documented as formally collected and recycled. key Takeaway Electronic waste is a worldwide challenge, but its generation and management differ greatly between regions. Reliable statistics show where waste is produced, while effective monitoring helps reveal how much is collected, recycled, or remains outside formal systems. As electronics consumption continues to grow, improving collection infrastructure, responsible recycling, and transparent reporting will be essential to building a